FY2014 Amtrak financials month by month

Amtrak Unlimited Discussion Forum

Help Support Amtrak Unlimited Discussion Forum:

This site may earn a commission from merchant affiliate links, including eBay, Amazon, and others.
Status
Not open for further replies.

Paulus

Conductor
Joined
Jul 13, 2012
Messages
1,469
All the performance reports. Included is a spreadsheet of every route for every month. Fair warning: Passenger and seat mile calculations get wonky for some months for a goodly number of the state supported corridors.

Why do this?

1) I am evidently really bored during winter break.

2) One spreadsheet to rule them all.

3) Because it allows me to find really weird things in Amtrak financial data, like the following

h9Oy9ko.png


NYRIZ6U.png
 
Only one issuse I see: You inverted the concept of an operating ratio (what you listed as an OR is actually cost recovery...the two are inverted: An OR is the percentage of income that is consumed by expenses).

Edit: Other than that error (a simple labeling issue), it all looks awesome and I thank you for the effort. It's interesting seeing some things:
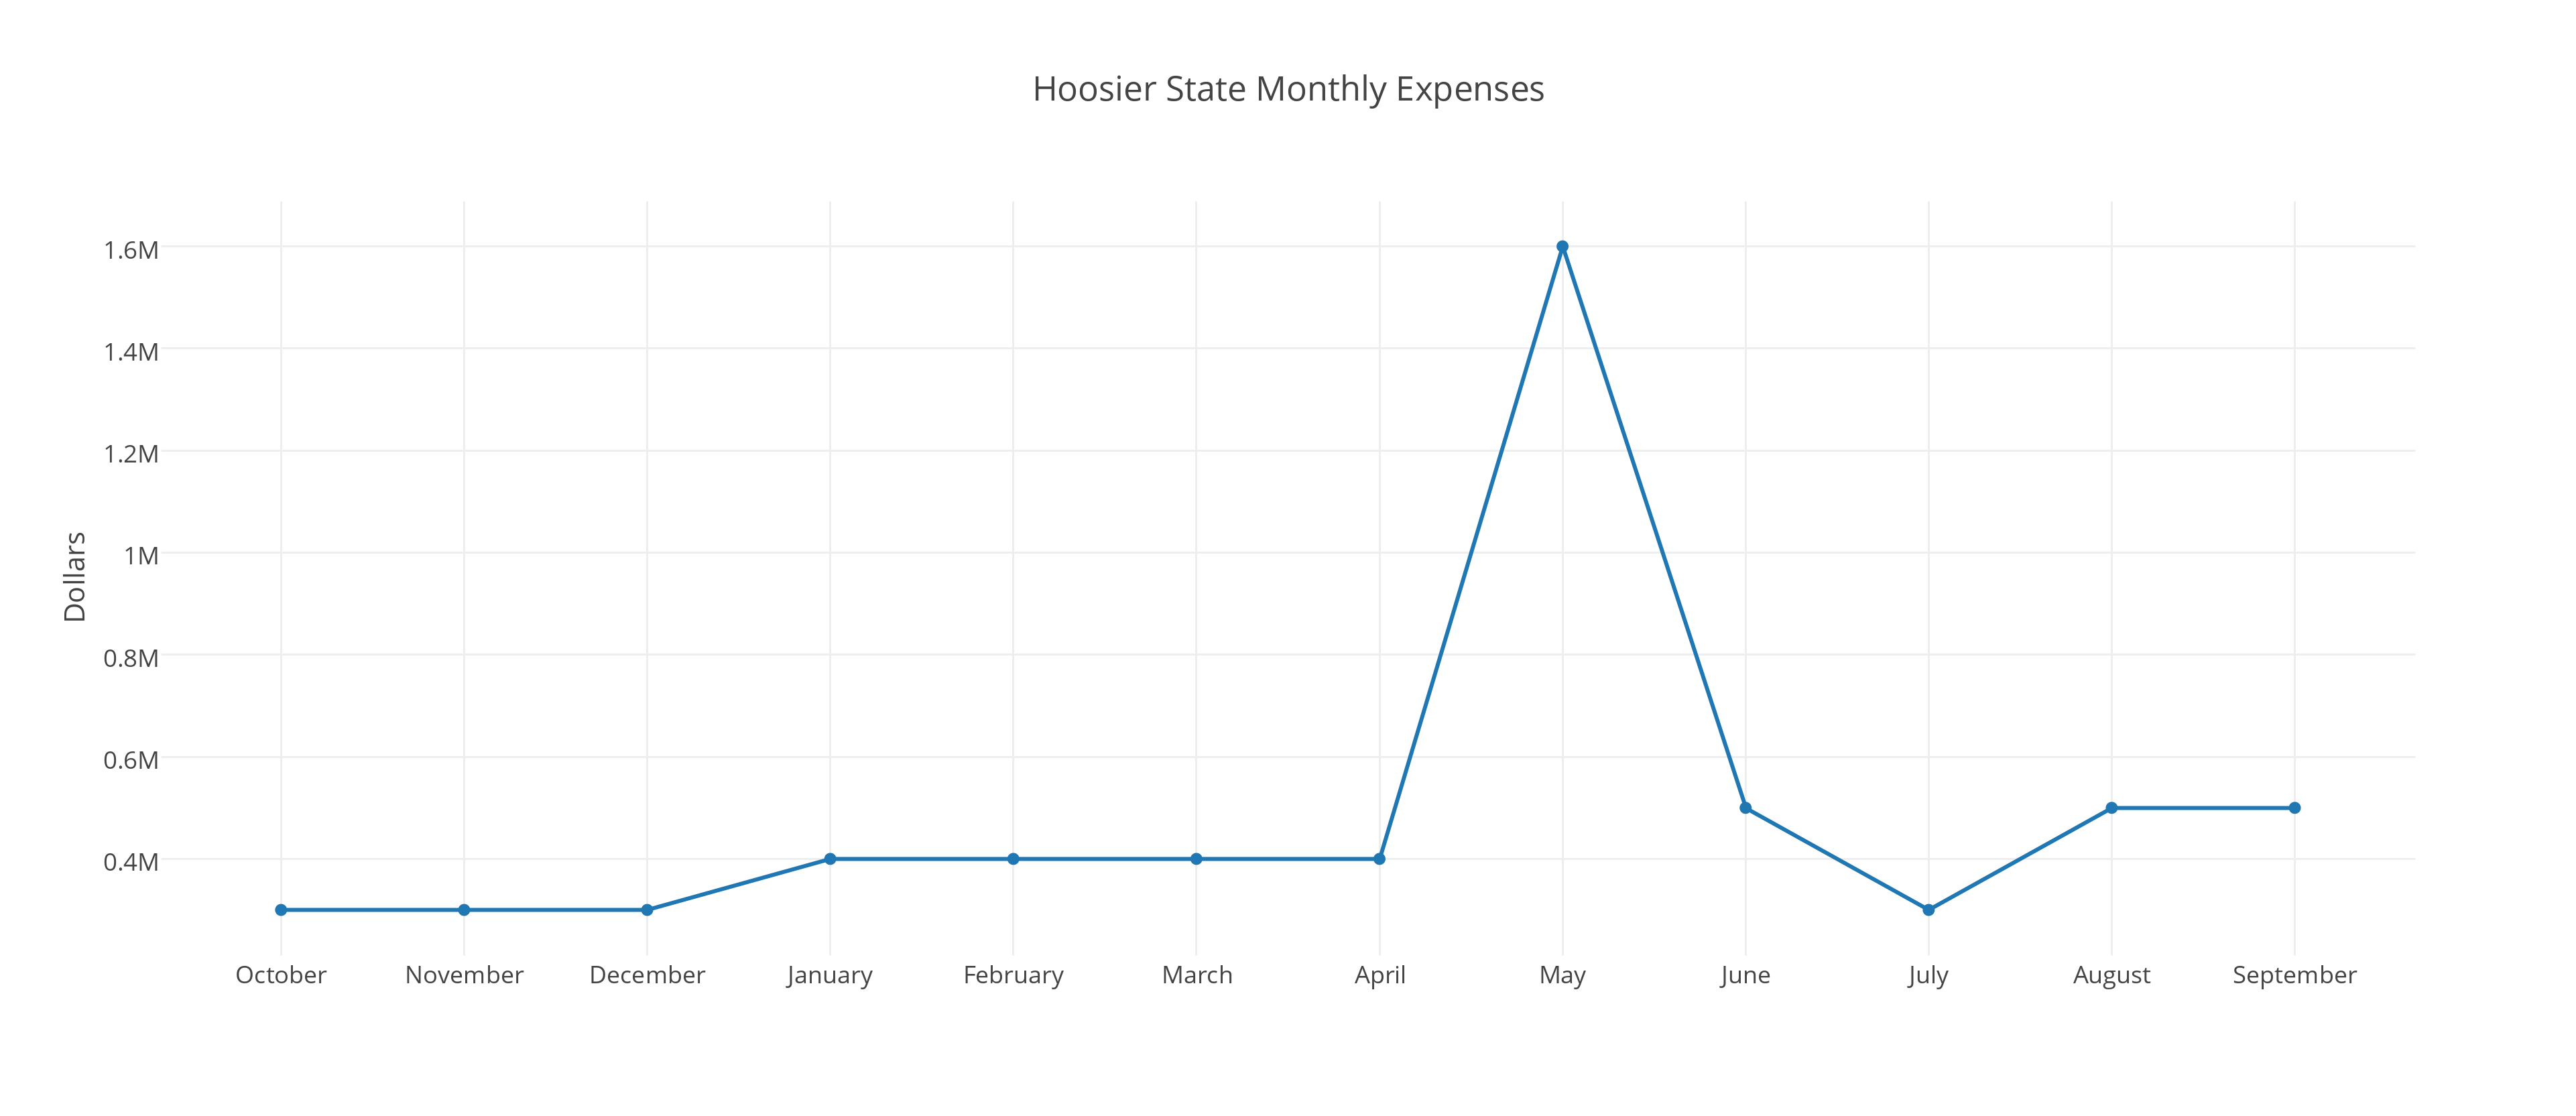
-In general, September tends to see a mild spike in expenses...probably due to Amtrak having to dump some un-allocated actual expenses somewhere before the end of the year. Basically, the month is used to resolve any outstanding accounting goofs (since planned and actual expenses almost never align perfectly).

-It looks like there was a reallocation of expenses onto the NE Regional and Acela trains starting in January. The Richmond trains were a major beneficiary (this is what put them into the black for the year), and the Pennsylvanian seems to have gotten a major benefit. On the other hand, the Carolinian also seems to have been stung.

--The LD system may or may not have been a beneficiary: A number seem to have seen a modest benefit to their expense lines, but this might be down to the commissary changes and amenity cuts. Of course, it would be wrong to say the two aren't related...it is quite possible that with the reduction in LD commissary expenses, a bunch of the related overhead ended up being shifted to the Regionals on the cost-basis of the food, for example.

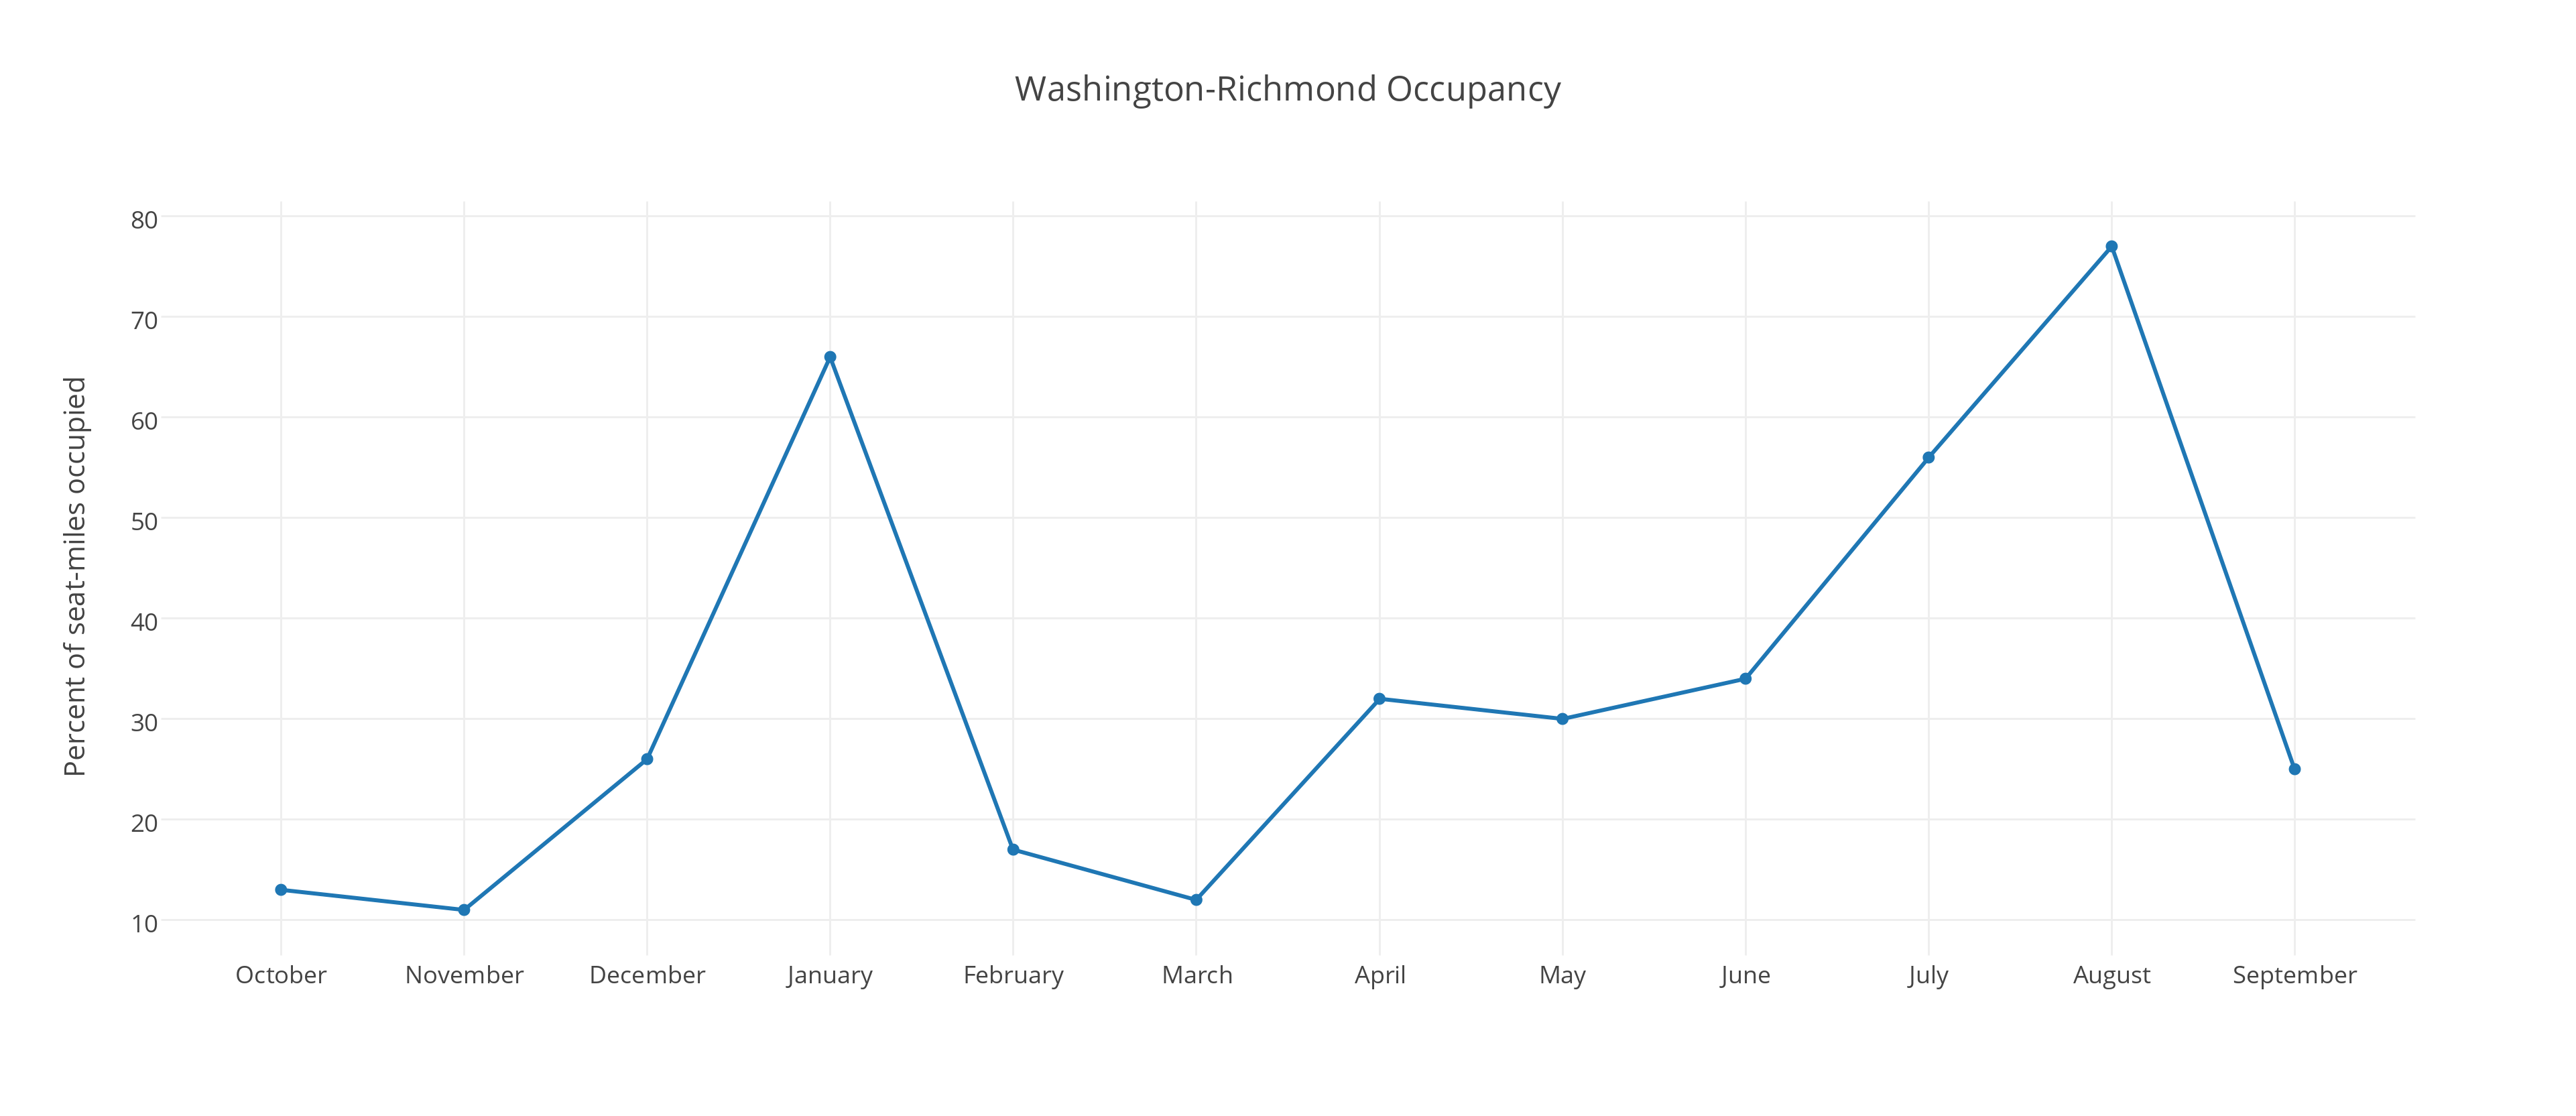
-It also does look like, at least on the NEC, there's some reallocation of expenses in line with revenues.

Also, the Contribution line makes no indication whether the amount is positive or negative.
 
Last edited by a moderator:
Only one issuse I see: You inverted the concept of an operating ratio (what you listed as an OR is actually cost recovery...the two are inverted: An OR is the percentage of income that is consumed by expenses).
Knew that I must've had something funky. Updated with that changed off to farebox recovery and a percentage figure.
 
That Hoosier State May expenses number is quite something.

I may be doing less amateur analysis of Amtrak finances for a while, because I'm trying to get Amtrak to respond to the very serious issues which render their food service unusable for anyone who's allergic to anything. I have now written an email to Boardman. We'll see if that gets a response, otherwise I'll have to escalate. Perhaps going through NARP would be the next step.

----

Further notes:

Contribution and contribution/pax-mile don't seem to be signed + or -, which is more than a little confusing, so I ignored those columns.

I still don't find the overhead-loaded numbers meaningful. :-(
 
Last edited by a moderator:
They were just there to provide numbers for the passenger and seat mile columns so I ignored whether they were positive or negative when throwing it together to eliminate one potential area of mistake. Thinking I might change that up when I do the FY15 sheet though
 
Last edited by a moderator:
Status
Not open for further replies.
Back
Top